Moos tower survey #1 maps
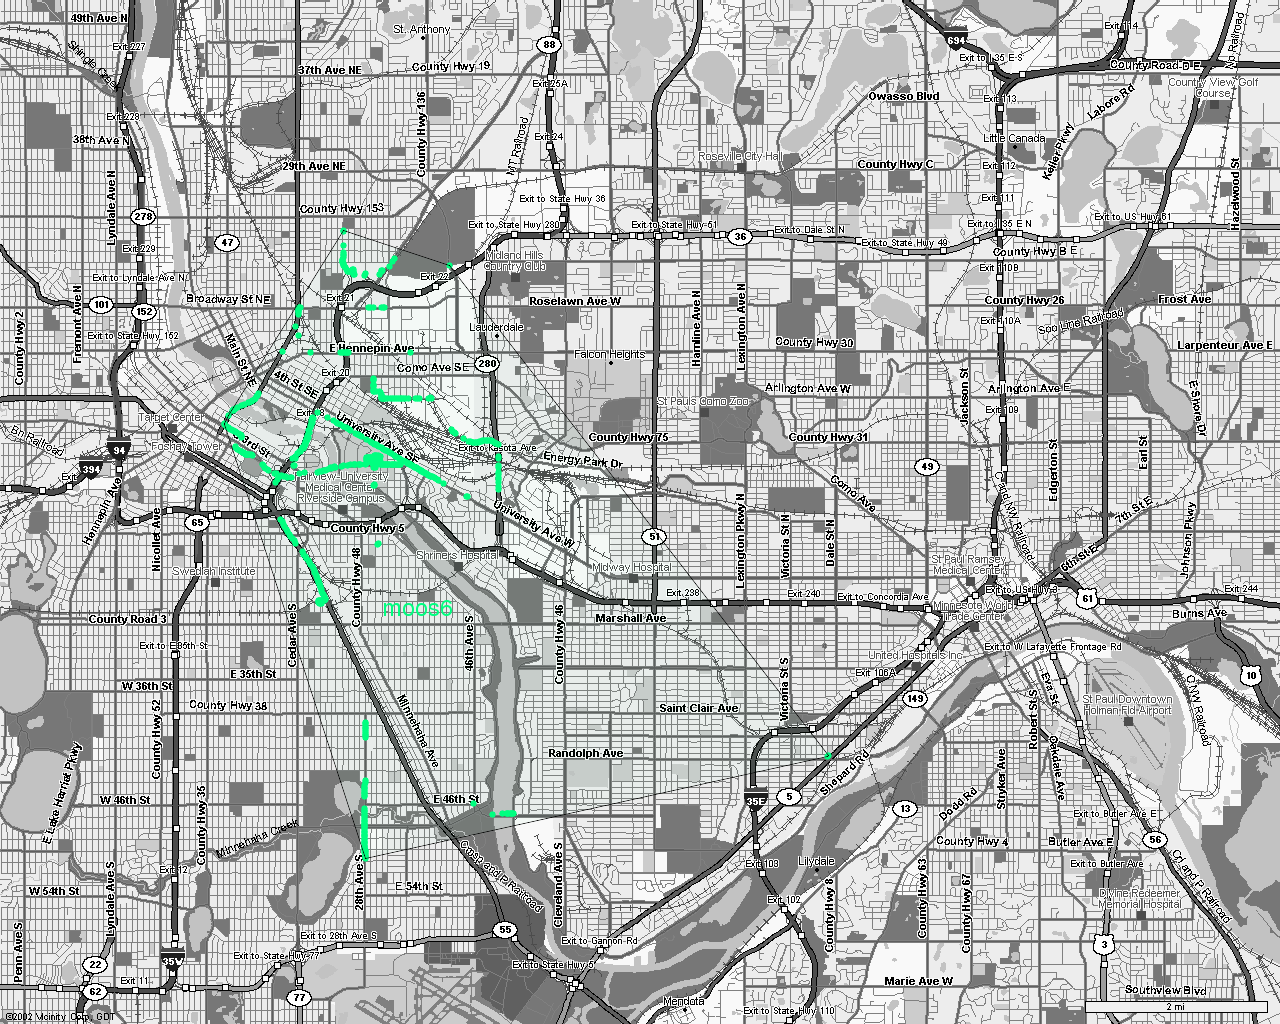
Moos-6 had the larger coverage area, despite being on the north side of the tower, here are the stats:
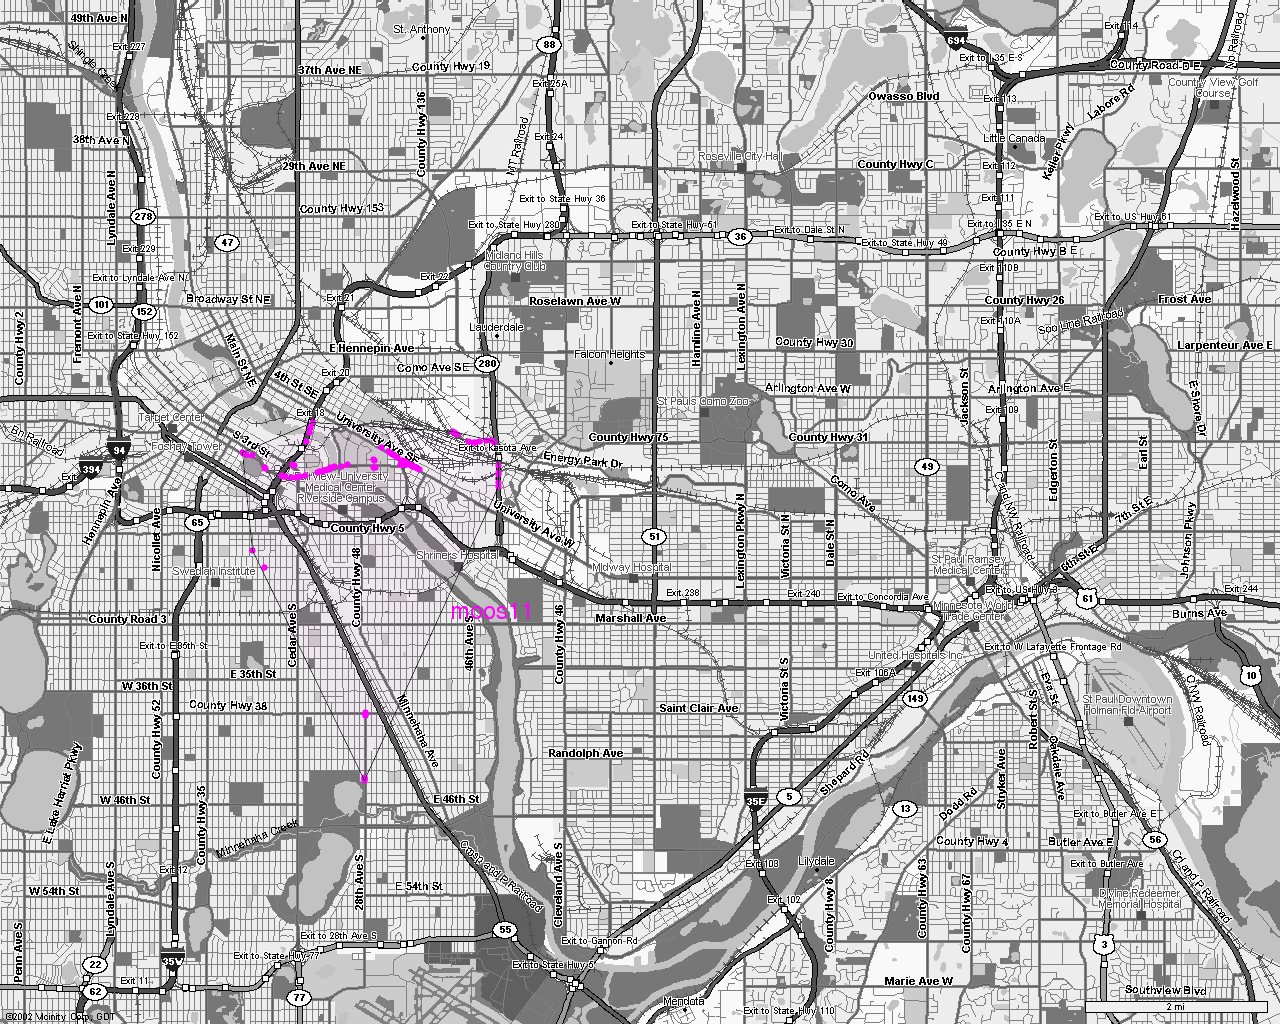
Net: moos11 [00:0A:8A:5F:33:3D]
Samples : 579
Min lat : 44.923187
Min lon : -93.260002
Max lat : 44.980389
Max lon : -93.202171
Min alt : 826.650024
Max Alt : 947.760010
Avg Lat : 44.954655
Avg Lon : -93.231804
Avg Alt : 853.670654
Avg Spd : 16.350819
H. Range: 25794.451611 ft
V. Range: 121.109985 ft
Net: moos6 [00:40:96:36:B6:3F]
Samples : 10638
Min lat : 44.910759
Min lon : -93.264030
Max lat : 45.011002
Max lon : -93.127731
Min alt : 804.599976
Max Alt : 1035.539917
Avg Lat : 44.955162
Avg Lon : -93.244232
Avg Alt : 878.213318
Avg Spd : 10.880744
H. Range: 51014.964258 ft
V. Range: 230.939941 ft
Here are the maps:
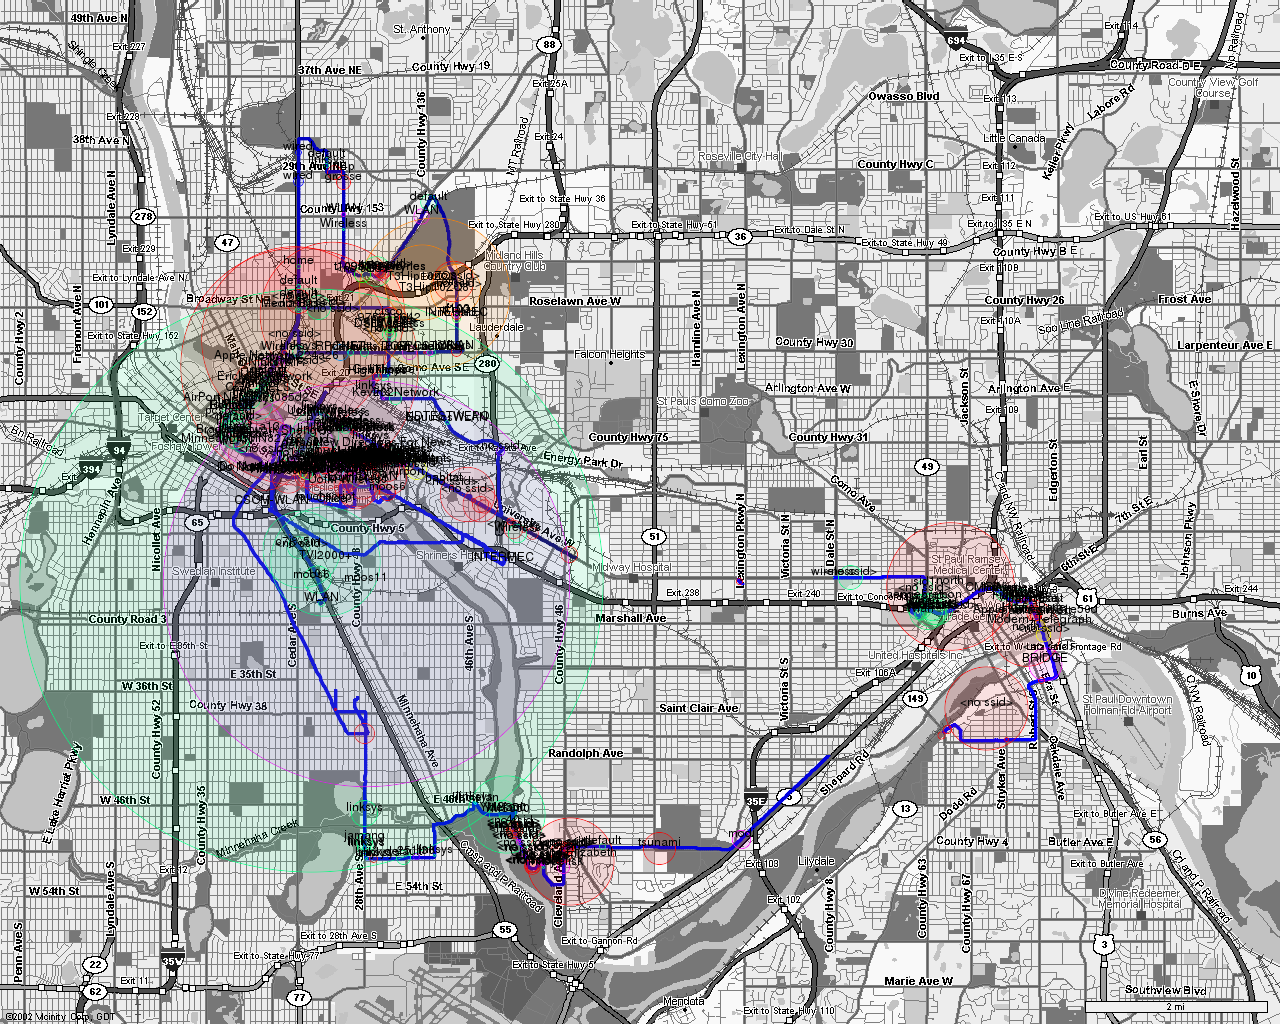
All the networks seen on the way (380 networks total, 82944 data points):
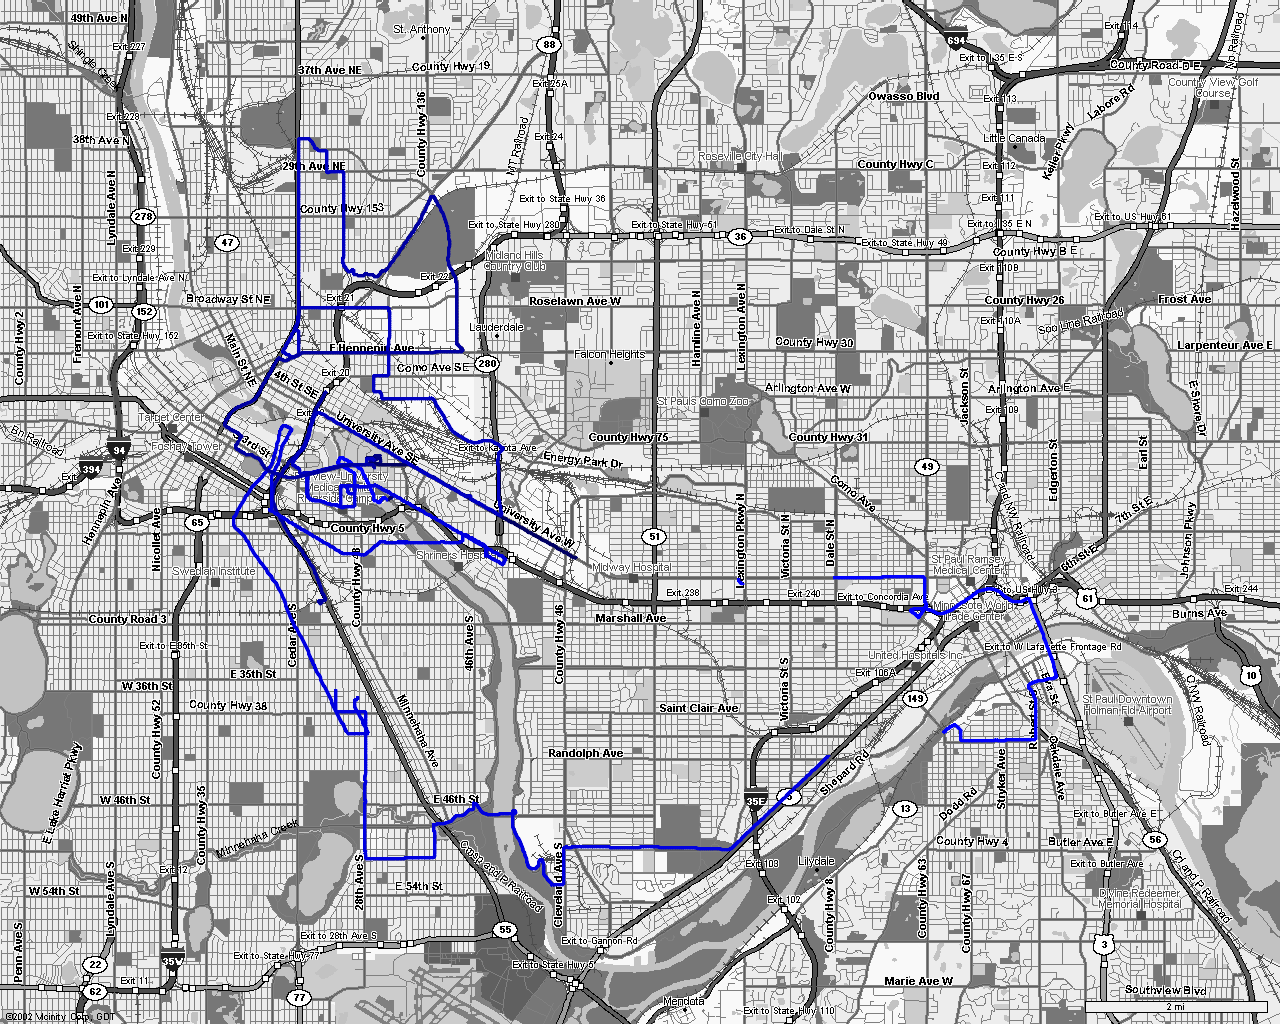
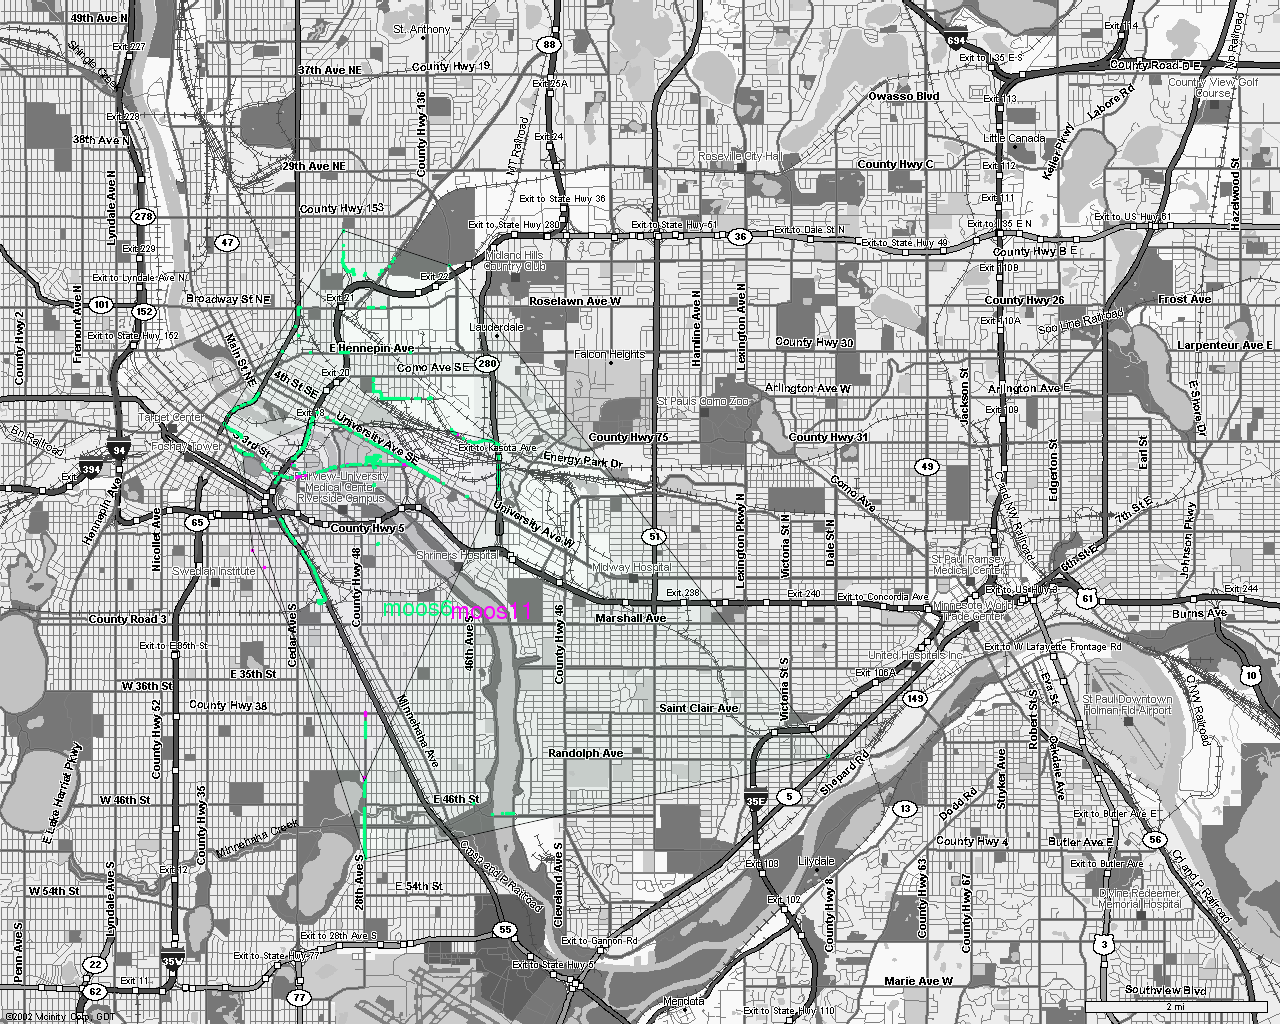
The track of where we drove:
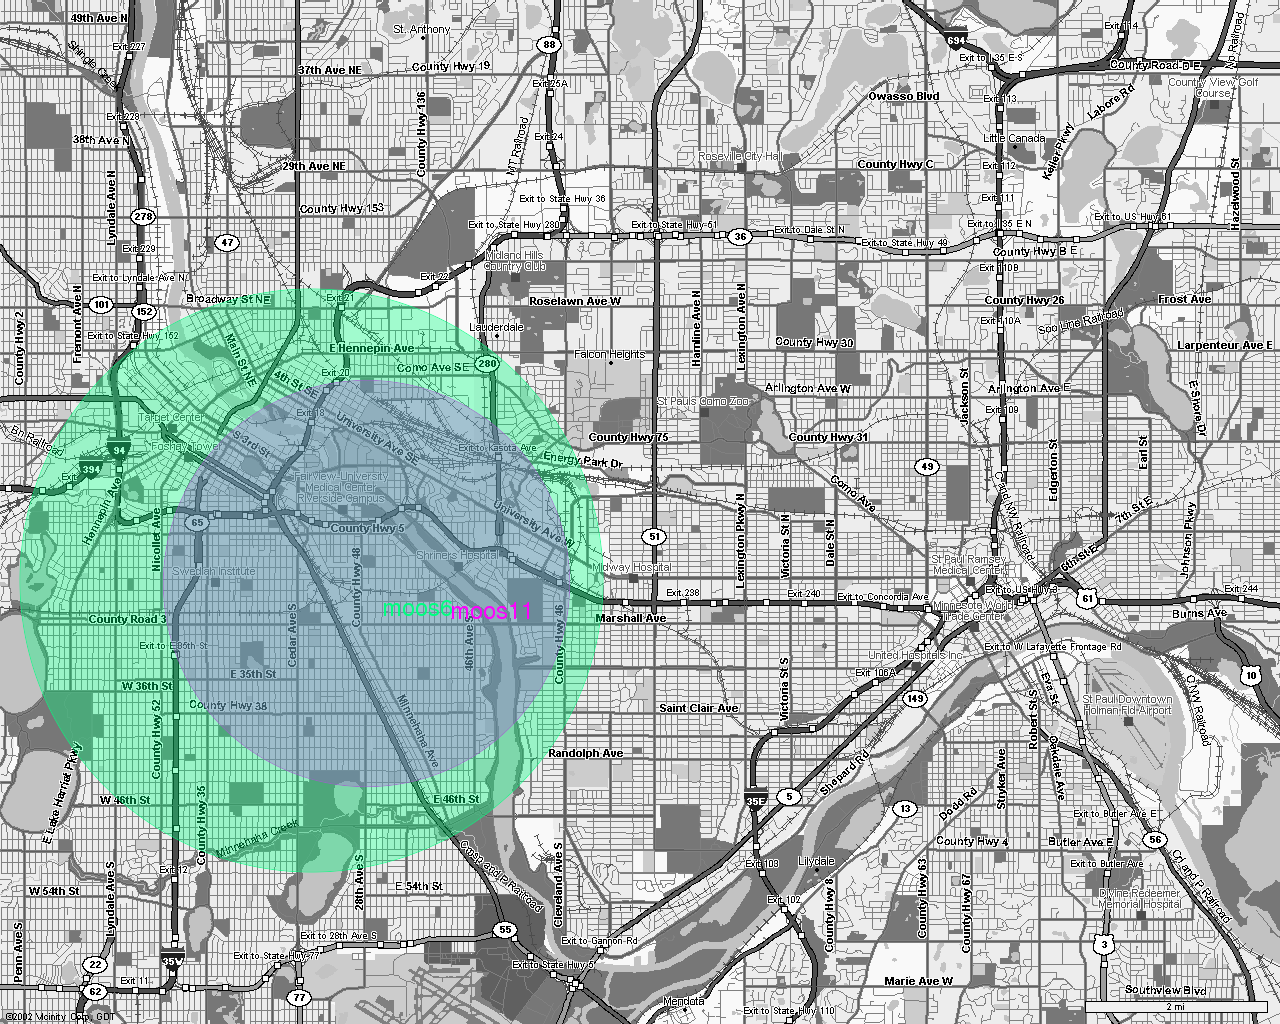
Estimated coverage, based on data from drive:
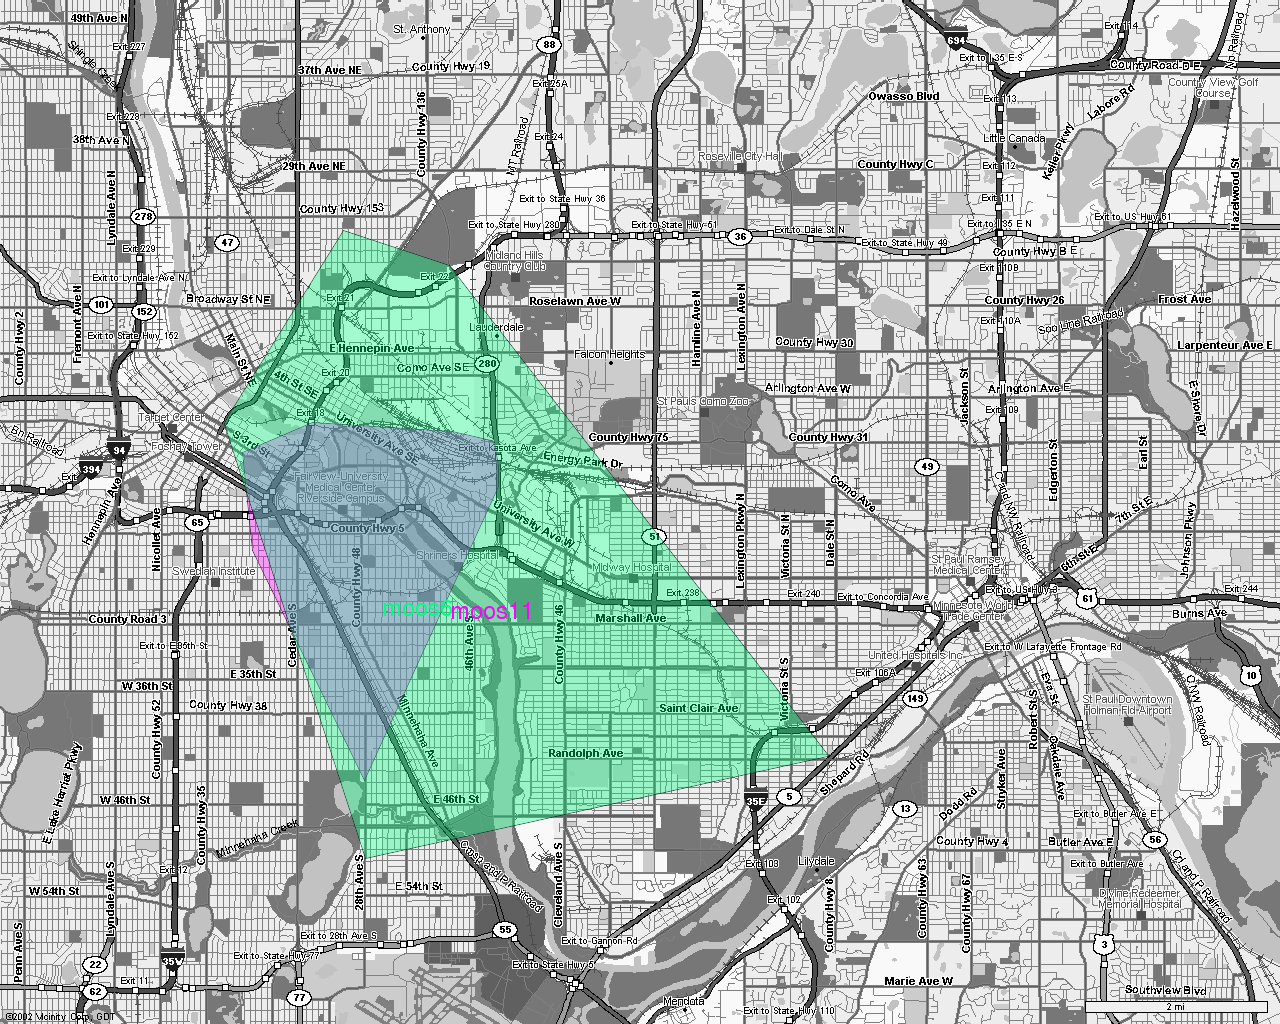
Actual coverage, based on data from drive:
Points where signal was actually picked up, colored by radio:
Moos 11 data points:
Moos 6 data points:
Previous data plotted on a satellite photo (1.7M):
Click if you're sure
Previous data plotted on a topo map (2.0M):
Click if you're sure